Image to sine waves

Hello lovely community!

I’m working on an p5.js algorithm to transform an image to sine waves, where the amplitude should visualize the grey level of the respective pixel.

In my current solution I’m iterating over every pixel with two for loops. For each row I start a new shape and for each pixel ‘tile’ on the x-axis I have three vertex points. One on the left side of the tile, one with the amplitude and one at the end of the tile. The amplitude is based on the greyscale of the respective pixel.

Here you can find the current version. I’m quit there, but can’t figure out why it still looks kind of buggy.

But the result should look more like this picture:

Any Ideas what’s wrong with my algorithm?

1 Like

Hi,

Welcome to the community! :slight_smile:

In fact, your sketch made my computer crash for a moment :sweat_smile: too much memory pressure on my 8GB RAM. You don’t need to redraw the same image at each draw() loop so you can use noLoop() to stop the loop at the end of the draw function.

I think that your approach is not the best solution to achieve this result. By putting three points for every pixel, you get this spiky, triangle shape every time. And if the amplitude is really high, it’s overlapping a bit.

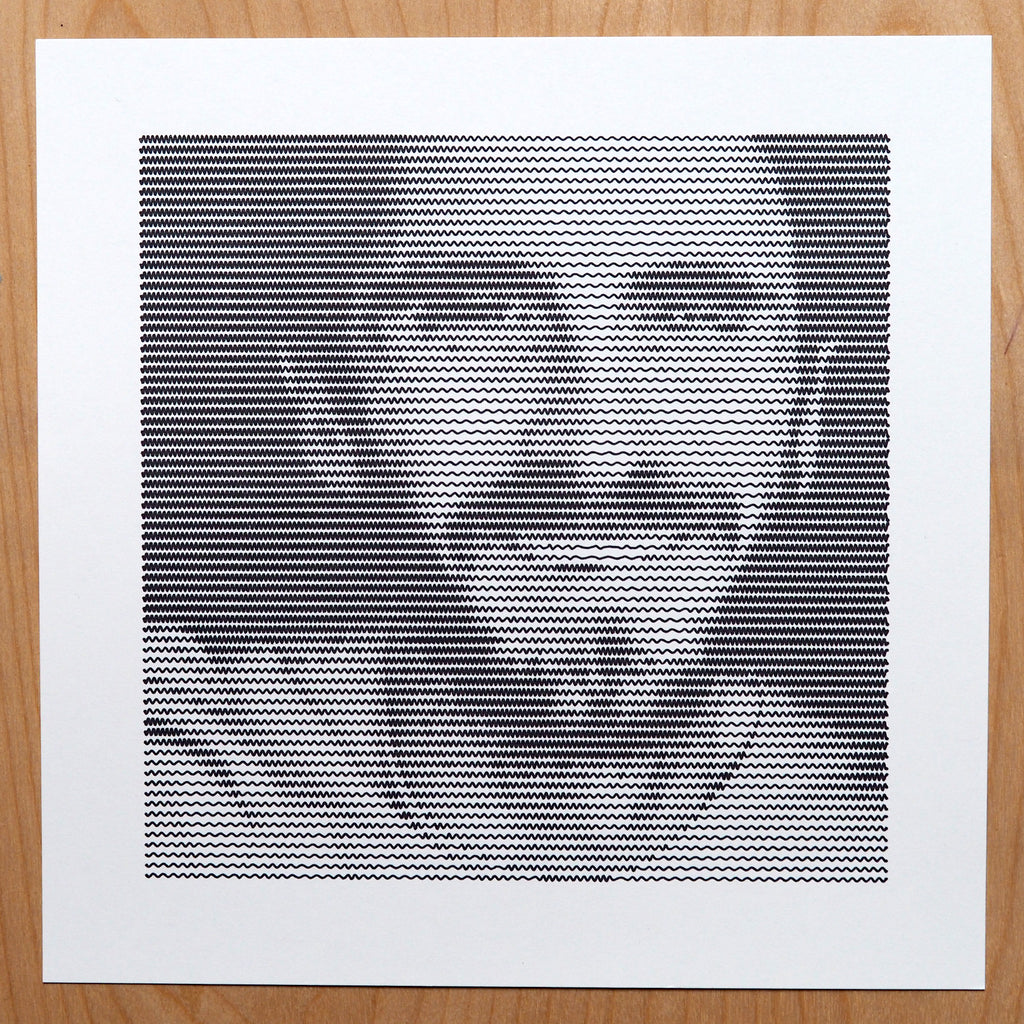
You can see that on the picture, this is a continuous curve with a sine shape. This implies that you need to use curveVertex() instead of vertex() to have a smooth line. Also, a single oscillation can spread on multiple pixels when the brightness is high so having points per pixel doesn’t work.

The basic idea is this :

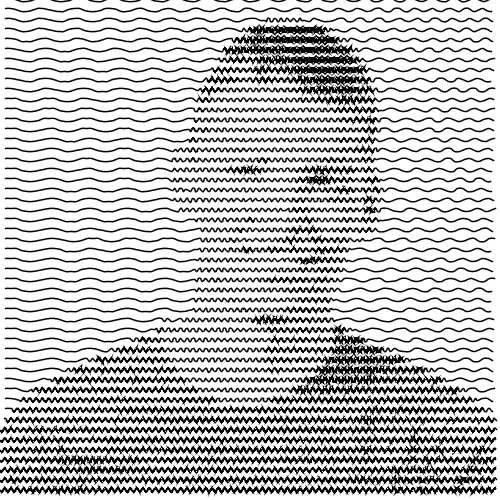
So darker pixels gives more high frequency sine waves. In order to do this, you need to put more points in the darker areas otherwise the resolution will not be enough. This is the opposite when there’s bright pixels, spreading the points give elongated curves. So in fact, the number of vertices for a given pixel is variable.

Now let’s compare those two graphs :

sine_simple sine_complex

The left one is the basic y = sin(x) an the second one is y = sin(x * x). For the second curve, as soon as we increase in the positive x direction, the frequency increase because we square x.

This is to show that if we vary x in a non linear way (not the first graph), we can dynamically vary the frequency of the curve.

You might also want to take into account the gap between the sine curves so they don’t overlap.

Here is a Processing code in Java to do that :

PImage portrait;

// Frequency of the waves multiplier
float sineIncr = 0.1;

// Height of the waves
float sineHeight = 10;

// The space between the curve rows
float spaceBetweenRows = 3;

void setup() {
  size(500, 500);

  portrait = loadImage("portrait.png");
}

void draw() {
  background(255);
  
  // Modify the stroke to have larger lines
  strokeWeight(1.5);
  
  portrait.loadPixels();
  
  // For every rows multiple of sineHeight
  for (int y = 0; y < portrait.height; y += sineHeight) {
    beginShape();
    // We start with a position of 0 for the sine function
    // Think of it as the x on the graphs
    float sinePos = 0;
    
    // Go until it fills the width
    while (sinePos < width) {
      // We have multiple points per pixel
      // So we have to pick the closest point for a x coordinate by rounding it
      int closestPixelLoc = round(sinePos) + y * portrait.width;
      
      // Compute the brightness of that pixel in [0, 1]
      float br = brightness(portrait.pixels[closestPixelLoc]) / 255.0;
      
      // The sine wave is oscillating above and under the pixel height
      curveVertex(sinePos, y + sin(sinePos) * (sineHeight / 2 - spaceBetweenRows));
      
      // We increase the x position of the sine wave
      // We use an exponential function to vary faster when the pixel is brighter
      sinePos += exp(br * 4) * sineIncr;
    }
    endShape();
  }
  
  // Break the loop
  noLoop();
}

wavy_portrait

In this code, I use the exponential function to increase the frequency a lot faster when the pixels are bright so it gives a non uniform look!

This is not perfect (there’s artifacts, it’s due mostly to the canvas resolution and curve detail…) but it works quite well. This is not in JavaScript but it’s easy to adapt to p5.js and it’s going to make you read and understand the code rather than copy pasting :slight_smile:

Have fun (I had too :wink: )!

4 Likes

Oh that looks very interesting. Could I use that code to integrate it into the Image-processing library ?

1 Like

Yeah sure, this is open code! :wink:
If you see possible improvements, let me know.

Thanks for this awesome explanation, helps me a lot to understand the solution :slight_smile:

I’ve been trying for hours to get the processing code of @josephh into p5.js but i can’t get it to run properly.

I’ve understood the code so far, but I don’t understand why the sinePos has no effect on the frequency of my sine waves. The brightness of each pixel seems to be determined correctly (values between 0 and 1) and the sinePos also contains plausible values between 0 and the width of the image.

here you can find my current solution:

have I missed anything?

Hi,

I’ve looked at your code and tried few times before I discovered what was causing this :

  • First pixels are not stored the same way in p5.js, if you look at the reference the four R, G, B, A values are stored inline not packed into one color value.
    This means that you need to multiply the index by 4 :

    const closestPixelLoc = 4 * (round(sinePos) + y * portrait.width);
    
  • Again this is not solving the problem because it’s actually the sineIncr value that is too low so the points were too close. It’s dependent on the resolution of the sketch. It works fine with a value of 1.

  • Also I noticed that there was no way to increase the overall frequency specially for darker areas, I added a waveMultiplier that multiplies the frequency when computing the sin :

    curveVertex(sinePos, y + sin(sinePos * waveMultiplier) * (sineHeight / 2.0 - spaceBetweenRows));
    

It goes like this :

let portrait;

// // Frequency of the waves multiplier
const sineIncr = 1;
// // Height of the waves
const sineHeight = 10;
// // The space between the curve rows
const spaceBetweenRows = 2;

// Sine wave multiplier
const waveMultiplier = 2;


function preload() {
  portrait = loadImage('queens-gambit-500.jpg');
}

function setup() {
  createCanvas(500, 500);
  print(portrait.width + ' • ' + portrait.height);
}

function draw() {
  background(255);

  // Modify the stroke to have larger lines
  strokeWeight(1);

  portrait.loadPixels();

  // For every rows multiple of sineHeight
  for (let y = 0; y < portrait.height; y += sineHeight) {
    beginShape();
    // We start with a position of 0 for the sine function
    // Think of it as the x on the graphs
    let sinePos = 0;

    // Go until it fills the width
    while (sinePos < width) {
      // We have multiple points per pixel
      // So we have to pick the closest point for a x coordinate by rounding it
      const closestPixelLoc = 4 * (round(sinePos) + y * portrait.width);

      // Compute the brightness of that pixel in [0, 1]
      const c = color(portrait.pixels[closestPixelLoc]);
      const br = brightness(c) / 255.0;

      // The sine wave is oscillating above and under the pixel height
      curveVertex(sinePos, y + sin(sinePos * waveMultiplier) * (sineHeight / 2.0 - spaceBetweenRows));

      // We increase the x position of the sine wave
      // We use an exponential function to vary faster when the pixel is brighter
      sinePos += exp(br * 4) * sineIncr;
    }
    endShape();
  }

  // Break the loop
  noLoop();
}

3 Likes