Hello,
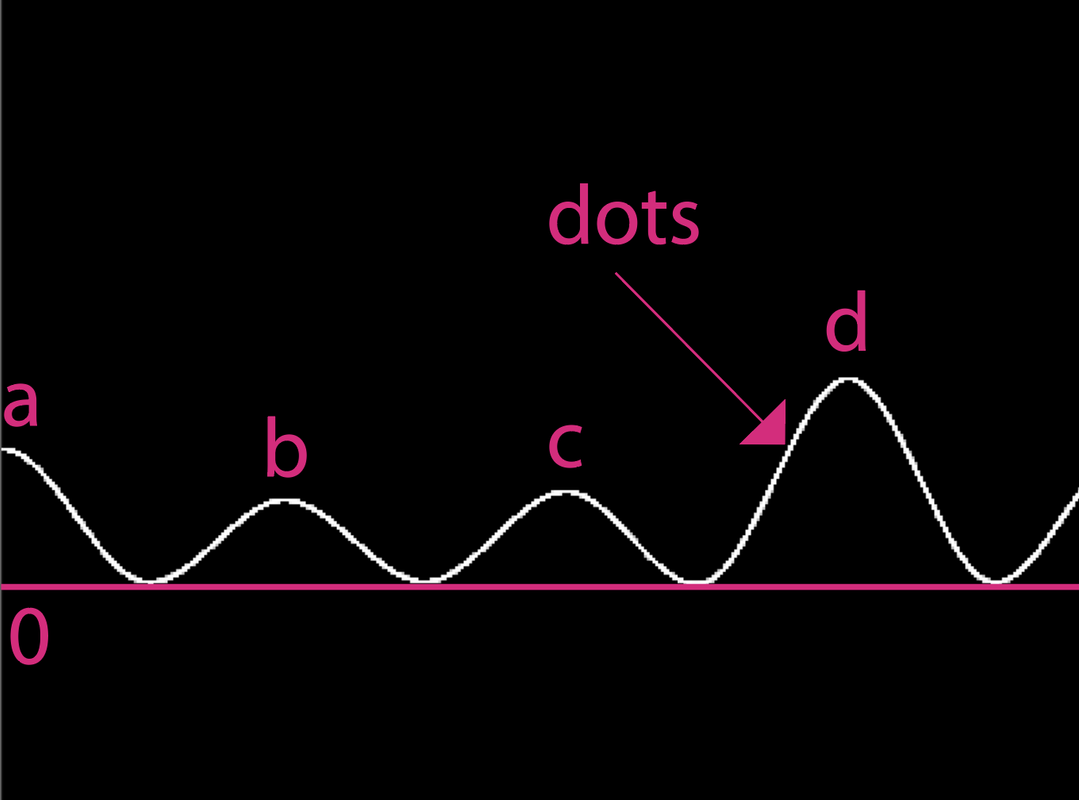
I’m stuck on a code for an output of a sinusoidal wave made out of single dots, i’m looking for a solution without using vertexCurve(). Please have a look at the image below for a better explanation:
The only values I can use are points a-b-c-d-…; as a result i’m looking for a wave of dots that connects all of my values in order to manage all single wave dot color (whilst creating gradients).
The wave type (curves types) must be as similar as possibile to the one shown in the picture.
I think the trick here is to realize that the “sine” wave you want is going back down to 0 half-way between each of your given points.
Then it’s just a matter of adding together one period of a sine wave (with the correct amplitude) centered at each point.
Something like this (but not this, because his doesn’t work right and I need more coffee):
float[] xs = {-100, 0, 100, 200, 300, 350, 400, 500, 600};
float[] ys = {      300, 100, 100, 100, 200, 350, 50};
// Note that the X positions have two additional points before and after
// All the others. This is to ensure every "real" point has a complete "range".

void setup() {
  size(600, 400);
  noStroke();
}

void draw() {
  background(0);
  fill(255);
  for ( int i = 1; i < xs.length-1; i++) {
    ellipse(xs[i], height - ys[i-1], 20, 20);
  }
  fill(200, 0, 0);
  for ( int x = 0; x <= width; x++) {
    float y = height;
    for ( int i = 1; i < xs.length-1; i++) {
      if ( (xs[i-1]+xs[i])/2.0 <= x && x <= (xs[i]+xs[i+1])/2.0 ) {
        y -= ys[i-1]/2.0;
        fill(random(255), 0, 0);
        y += ys[i-1] * sin(map(x-xs[i], (xs[i-1]+xs[i])/2.0, (xs[i]+xs[i+1])/2.0, -HALF_PI, HALF_PI));
      }
    }
    ellipse(x, y, 5, 5);
  }
  noLoop(); // Drawing it once is plenty.
}

// Dangit, I can't get this working.
// Someone else jump in here, would you?
Thank you for your reply!
That’s correct, after reaching one point (a-b-c-d-…) the wave goes back to 0 and then up again to another value.
Please note that each value (i have an array containing about 1000 numbers in it) may vary a lot from one to another (i.e. from 150 to 20.000), that’s why the curve must be as smooth as possibile (not spiked) while maintaining the same curve type throughout the wave (something similar to the image above).
HI
I don’t think the value itself is crucial, since the code must work with any int value eventually stored in the array (they go from 100 up to 20.000 for example).
Their y value is the value itself stored in the array.
Their x value is managed by a for cycle, i will show you my code that uses curveVertex() which is the same code used to obtain the image i posted above:
      int array_of_values[] = new int [10000]; //i load my numbers in the array from a table inside a .csv file
      int spacing =10;
      int position=0;

      beginShape();
      curveVertex(0,  array_of_values[0]); //first curve vertex, to be written twice

      for(int i = 0; i < array_of_values.length; i++) {

      noFill();
      strokeWeight(10);
      stroke(255, 0, 0);

      //DRAW WAVES
      curveVertex((i*spacing)-spacing/2,  height); //goes down to 0
      curveVertex(i*spacing,  array_of_values[i]); //goes up to the value
      position=i;
      }
      curveVertex(position*spacing, array_of_values[array_of_values.length]); //end shape, to be written twice
      endShape();
I could post an image of the .csv table in order to show you the values, but i don’t think it could help.
Thanks in advance!
float[] xs = {-100, 0, 100, 200, 300, 350, 400, 500, 600};
float[] ys = {      300, 100, 100, 100, 200, 350, 50};
// Note that the X positions have two additional points before and after
// All the others. This is to ensure every "real" point has a complete "range".

float px, py;

void setup() {
  size(600, 400);
  noStroke();
  px = 0;
  py = height;
}

void draw() {
  background(0);
  fill(255);
  noStroke();
  for ( int i = 1; i < xs.length-1; i++) {
    ellipse(xs[i], height - ys[i-1], 20, 20);
  }

  stroke(200,0,0);
  strokeWeight(2);
  for ( int i = 1; i < xs.length-1; i++) {
    csw(
      (xs[i-1]+xs[i])/2.0, height - ys[i-1],
      (xs[i]+xs[i+1])/2.0, height);
  }
  noLoop(); // Drawing it once is plenty.
}

void csw(float x, float y, float xx, float yy) {
  pushMatrix();
  translate(x, (y+yy)/2.0);
  for ( int dx = 0; dx <= xx-x; dx++) {
    float cx = dx;
    float cy = ((yy-y)/2.0)*cos(map(dx, 0, xx-x, 0, TWO_PI));
    line(px,py,cx,cy);
    px = cx;
    py = cy;
  }
  popMatrix();
}


// Dangit, I still can't get this working.
// Someone else jump in here, would you?
That’s my second stab at it.
Why are you avoiding using curve vertex if you have it working using curve vertex?!?!?
I’m having trouble (while bothering you guys ) on getting a “dot” version because i want to use gradients for coloring the wave.
I.e. i would use one color for curves between the value, another for curves near 0, and melt the color inbetween creating a gradient effect.
I can only achieve this result by changing the color of every single dot that composes my sine wave. Or maybe there’s an easier way to do this?
You need to use a map. Draw your curve in pure white to an off-screen PGraphics object, and use that to “punch out” the curve on a gradient. Then just draw that as an image.
PGraphics grad, curv;

void setup() {
  size(600, 400);

  float x = 100;
  float y = 100;
  float xx = width - 100;
  float yy = height - 100;

  curv = createGraphics(width,height);
  curv.beginDraw();
  curv.background(0);
  curv.noStroke();
  curv.fill(255);
  curv.pushMatrix();
  curv.translate(x, (y+yy)/2.0);
  for ( int dx = 0; dx <= xx-x; dx++) {
    curv.ellipse(dx, ((yy-y)/2.0)*cos(map(dx, 0, xx-x, 0, TWO_PI)), 5, 5);
  }
  curv.popMatrix();
  curv.endDraw();

  grad = createGraphics(width,height);
  grad.beginDraw();
  grad.colorMode(HSB, 600);
  for( int t = 0; t < height; t++){
    grad.stroke(400-t, 600, 600);
    grad.line(0,t,width,t);
  }
  grad.endDraw();
}

void draw() {
  // Note that I'm using a dark green background to show that only the colored curve is draw by the call to image!
  background(0,100,0);

  // Use these lines to see what the grad and curv drawings look like.
  // Be sure to comment out the image() call below too!
  //image( curv.get(), 0, 0 );
  //image( grad.get(), 0, 0 );

  // Apply the mask.
  grad.mask(curv.get());
  // Show the gradiant-ed curve!
  image( grad.get(), 0, 0);

  noLoop();
}
Wow thank you!
It looks really nice but using masks doesn’t allow me to maintain the same color for every single peak, this way the sine wave “simply” colors itself by using the background behind it. Please consider that values may vary a lot from one to another, some number can be veeeery high.
As a result I want to have all of the a-b-c-d-… “curved peaks” with the same color.
Hi, and Thanks!
i will try this as soon as i can!
Meanwhile, watching your cool result i want to ask you if you know a way to keep the lowest peak always at 0 after going up to reach the y designated value.
The logic should be:
-reach the value of the array (the “Y peaks”)
-go back to 0
and repeat with the same spacing in between each step (as you did in your code).


 ) on getting a “dot” version because i want to use gradients for coloring the wave.


