@zwiesabel
I would advise against mixing pixel-based and vector-based shapes. It would be preferable, from both an aesthetic and technical point of view, to remain consistent by limiting yourself to just one of these objects throughout your project.
Having said that, I think you need to go back and think more broadly about the different techniques that are usually associated with this kind of pattern. Only then will you realize that the rhomboid shape you’re so concerned about doesn’t really matter, as it’s usually the mere by-product of a more general logic.
Among the approaches worth investigating are Truchet tiling (specifically, Smith tiles) and metaballs. Although these methods produce patterns slightly different from those shown in your example, they provide excellent starting points for considering possible solutions.
1/ Tiling system
You could certainly design your own tiles and arrange them generatively within a grid, using simple constraint satisfaction solvers or stochastic texture synthesis algorithms (such as WFC or MSTS). Some tiles could represent arcs or squares, while others would depict curved corners. Most of them would have to be flipped and rotated.
The concave rhombus would then be the product of assembling 4 tiles with matching patterns.
As you can imagine, this approach is relatively tedious to set up (tile design + adjacency rules + implementation) and has the added disadvantage of being fairly inflexible (a wider space between the circles or a change in color would require the entire tile set to be redesigned).
2/ Grid layout
A somewhat similar but more flexible approach would involve manipulating geometric shapes directly instead of managing pixelated tiles. Inspired by the grids used in typography to create letters and glyphs, you could create a series of circles aligned in an orthogonal grid and play with the spaces between them to form curved rhombuses or diamonds.
Here, it is the geometric difference between an ellipse and the square cell it occupies that creates curved corners that, when blended together, form a rounded connection between two circles. In a way, this can be likened to the concept of negative space (or closure) in Gestalt theory.
In recent years, there have been many fonts created based on this very basic principle. And logically, they all resemble the patterns you’re trying to reproduce. See for yourself:
Also worth mentioning is this interactive Processing sketch from SchultzSchultz Graphik (2022).
3/ Metaballs
Last but not least. Metaballs are organic shapes formed by blending multiple circles or spheres based on their mutual influence within a scalar field. It generally involves creating an iso-surface, which is computed either by calculating inverse distances (both pixel-based and vector-based) or by using techniques such as Marching Squares or Meandering Triangles (primarly vector-based). Posterization using SVG filters can also produce similar visual effects.
The issue with these approaches is that they are typically limited to points (or circles) within a distance field, making them unsuitable for manipulating geometric elements of varying shapes.
However, there is a visually similar approach that would be particularly suitable for your project and is often underappreciated: the ‘shrink-wrap’ method.
This involves approximating the closing of a set of polygons by inwardly offsetting the outward offset of the entire shape. More specifically, it’s the ‘erosion’ process applied after the preceding ‘dilation’.
Note that the PGS library offers a built-in method specifically designed for this task (see the minimal example provided by its author here).
It’s the simplest workaround I can think of, as it only involves placing circles and rectangles without needing at all to address the connections between them.
Please find below a simple example script written in py5 (a version of Processing for Python 3.9+). The logic is as follows:
- create a categorical matrix (integers between 0 and 2 - or more)
- traverse it recursively as an undirected graph
- cluster adjacent nodes with similar values (Moore neighborhood)
- create rectangular shapes between each pair of orthogonally connected nodes
- also create a circle around each visited node
- compute an approximation of the closing of each set of shapes using
PGS_Morphology.dilationErosion()
Anotated Script
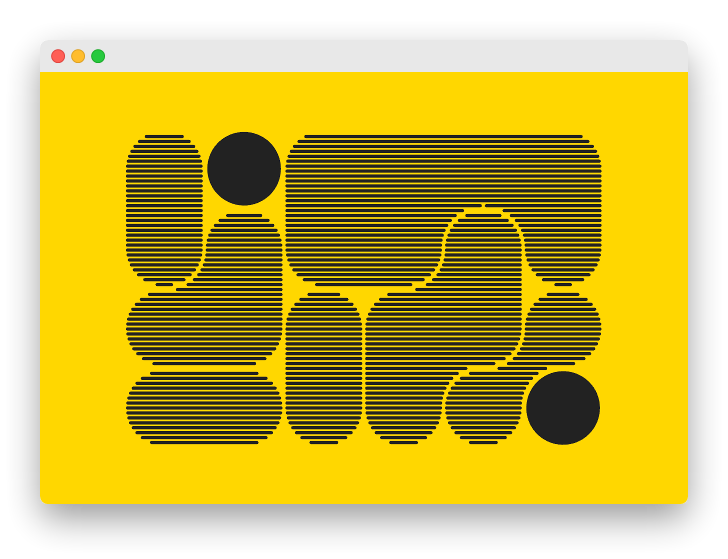
"""
Simple script demonstrating how to generate patterns reminiscent of metaballs and of
Smith tiles (a variant of Truchet tiles).
Illustrate the concept of a "closing" (dilatation / erosion of a set) in comp. geom.
Differences with Truchet patterns: no tilling system, non-periodicity.
Differences with traditional m-balls: no iso-surface, no marching squares, no SVG filters

# Author: sol/ub ◐
# Created: 2024-10-05
# Python Version: 3.9
# Music: Brew - Daisuke Miyatani
# Context: Reply to @zwiesabel -> t.ly/croZv (Processing Discourse Forum)

"""

from collections import defaultdict
from micycle.pgs import *


W, H = 720, 480  # Dimensions of the canvas (W*H)
X, Y = 6, 4      # Dimensions of the grid/matrix (X*Y)
G, E = 6, 74     # Circle's parameters (gap & extent/diameter)
O    = 42        # Offset distance (outward-inward)

Tx = (W - (E+G) * (X-1)) / 2  # Translation horizontally
Ty = (H - (E+G) * (Y-1)) / 2  # Translation vertically

BG = '#EBEBEB'   # Background color
FG = '#252525'   # Foreground color
SW = 2           # Stroke weight


def setup():
    size(W, H, P2D)
    smooth(8)


def draw():
    background(BG)
    translate(Tx, Ty)

    # X*Y quaternary matrix (flattened)
    keys = [int(round(random(3))) for i in range(X*Y)]

    # Find all islands & populate them with circles + rects
    islands = connect_components(keys, Y, X)

    # Compute the 'closing' (approximation) of each isle
    for isle in islands:
        shapes = PGS_Conversion.flatten(*isle)
        closing = PGS_Morphology.dilationErosion(shapes, O)
        closing.setStroke(color.Colors.BLACK)
        closing.setStrokeWeight(SW)
        closing.setFill(color.ColorUtils.composeColor(0, 0, 0))
        shape(closing)

    no_loop()


def mouse_pressed():
    redraw()


def connect_components(flat_matrix, nrow, ncol):

    """
    Traverse a discrete-valued categorical matrix (binary, n-ary) as an undirected
    graph and create rectangular shapes between each pair of orthogonally connected
    components. A circle is also centered around each visited node.


    Args:
        matrix (1D list): a flattened 2D matrix of integers.

    Returns:
        islands (2D list of PShapes): list of rectangles & circles for each island


    Note: An 'island' refers to a set of connected components made up of adjacent
          nodes (Moore neighborhood) sharing the same value.
    """

    # 8 possible directions (Moore neighborhood in anticlockwise order)
    directions = [(1, 0), (1, -1), (0, -1), (-1, -1), (-1, 0), (-1, 1), (0, 1), (1, 1)]

    # Define the parameters of a rectangle and the location of an antidiagonal (lambdas)
    # based on the orientation (integer) of a pair of neighboring nodes
    conditions = {0: lambda x, y: (x - (E * 0.5), y, E, E + G),     # downward rectangle (vertically)
                  2: lambda x, y: (x, y - (E * 0.5), -(E + G), E),  # leftward rectangle (horizontally)
                  4: lambda x, y: (x - (E * 0.5), y, E, -(E + G)),  # upward rectangle (vertically)
                  6: lambda x, y: (x, y - (E * 0.5), E + G, E),     # rightward rectangle (horizontally)

                  1: lambda x: (x - 1, x + X),   # left to bottom anti-diagonal   \ ◣
                  3: lambda x: (x - 1, x - X),   # left to top anti-diagonal      / ◤
                  5: lambda x: (x + 1, x - X),   # right to top anti-diagonal     \ ◥
                  7: lambda x: (x + 1, x + X)}   # right to bottom anti-diagonal  / ◢


    visited_neighbors = defaultdict(set)
    nodes_to_visit = set(range(len(flat_matrix)))


    def dfs(i, shapes=None):

        # if this is the first non-recursive call -> initialize 'shapes'
        if shapes is None:
            shapes = []

        # else -> mark the current node as 'visited'
        else:
            nodes_to_visit.remove(i)

        # get row and column for the current index
        row, col = divmod(i, ncol)

        # get the corresponding coordinates
        x = (col*E)+(col*G)
        y = (row*E)+(row*G)

        # create a circle centered around the current node & add it to the bag-of-shapes
        c = create_shape(ELLIPSE, x, y, E, E)
        shapes.append(c)

        # for each direction:
        for j, (dr, dc) in enumerate(directions):

            # calculate the row and column of the neighbor
            nr, nc = row + dr, col + dc

            # check if the neighbor is inside the grid bounds
            if 0 <= nr < nrow and 0 <= nc < ncol:

                # convert 2D coordinates back to 1D index
                ni = nr * ncol + nc

                # if the neighbor shares the same value and this pair hasn't been visisted yet:
                if flat_matrix[ni] == flat_matrix[i] and ni not in visited_neighbors[i]:

                    # if the pair is orthogonally aligned:
                    if not j&1:

                        # -> create a rectangle between them & add it to the bag-of-shapes
                        r = create_shape(RECT, *conditions[j](x, y))
                        shapes.append(r)

                    # if the pair is aligned diagonally:
                    else:

                        # -> discard the connection if it crosses another perpendicularly
                        if all(pos not in nodes_to_visit for pos in conditions[j](i)):
                            continue

                    # mark the pair as 'visited'
                    visited_neighbors[i].add(ni)
                    visited_neighbors[ni].add(i)

                    # if the neighbor node hasn't been visited yet:
                    if ni in nodes_to_visit:

                        # -> visit it recursively
                        dfs(ni, shapes)

        return shapes


    # Find all islands & populate them with shapes until every node has been visited
    islands = []
    while nodes_to_visit:
        islands.append(dfs(nodes_to_visit.pop()))

    return islands


