Using p5.js, I have some data from a .csv file (in this case 1200 points) which I’m trying to plot.
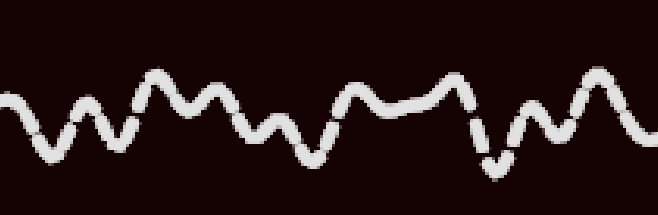
To do so, I have placed the points inside a beginShape() ... endShape() object. Here is a screenshot of part of the result:

It seems to have gaps in the line, and very low resolution. Zooming in with the browser still shows that:
I would like it to be a continuous line with high resolution. Here are some things I’ve tried:
-
createCanvas()using optionsdisplayWidthorwindowWidth - tested it in different screens with different resolution
- changed
strokeWeight() - use
vertex()orcurveVertex() - stretch or shrink x-axis (in the code below, mapping the
rin vertices tor/2or2r
Here’s the part which defines the curve:
beginShape(LINES)
     for (let r = 0; r < nr_points; r++) {
      vertex(r, all_points[r][1]);
      // curveVertex(r, all_points[r][1]);
     }
endShape();
What should I try next? Or is there a different strategy that I’m missing?
(context note: If possible, I would prefer not to use a standard plotting library, like matplotlib or such, because the graph is part of an artistic context which needs a lot of tweaking)