# How to create animated line graph in Processing?
**URL:** https://discourse.processing.org/t/how-to-create-animated-line-graph-in-processing/16643
**Category:** Coding Questions
**Created:** [December 26, 2019, 5:44pm UTC](https://discourse.processing.org/t/how-to-create-animated-line-graph-in-processing/16643 "2019-12-26T17:44:06Z")
**Posts on this page:** 6
**Page:** 1
### Author:  [@bluefern](https://discourse.processing.org/u/bluefern)
#### Post date: [December 26, 2019, 5:44pm UTC](https://discourse.processing.org/t/how-to-create-animated-line-graph-in-processing/16643/1 "2019-12-26T17:44:07Z")
I´m trying to make an animated line graph using data from .csv

I want to animate the lines and add the name of the series to the end of the line like this example:
> Household debt balances (excluding mortgages) [pic.twitter.com/gJbL5WIv05](https://t.co/gJbL5WIv05)
>
> — 📈 𝙻𝚎𝚗 𝙺𝚒𝚎𝚏𝚎𝚛 📊 (@lenkiefer) [13 de enero de 2019](https://twitter.com/lenkiefer/status/1084450545295917056?ref_src=twsrc%5Etfw)
Also I want to animate the x-axis and y a-xis.
Here’s the example I’m trying to emulate: [https://pythonprogramming.net/static/images/matplotlib/live-matplotlib-graph-tutorial.gif](https://pythonprogramming.net/static/images/matplotlib/live-matplotlib-graph-tutorial.gif)
Is it possible to make this graph using processing?
Which library should I use?
Any suggestions?
---
### Author:  [@glv](https://discourse.processing.org/u/glv)
#### Post date: [December 26, 2019, 8:44pm UTC](https://discourse.processing.org/t/how-to-create-animated-line-graph-in-processing/16643/2 "2019-12-26T20:44:55Z")
Hello,
It certainly is possible.
Check out the examples and tutorials here:
[https://processing.org](https://processing.org)
[https://processing.org/tutorials/](https://processing.org/tutorials/)
[https://processing.org/tutorials/data/](https://processing.org/tutorials/data/)
[https://processing.org/tutorials/trig/](https://processing.org/tutorials/trig/)
[https://processing.org/reference/](https://processing.org/reference/)
🙂
A simple plot example to get you started:
```auto
int limit;
float x, y;
void setup()
{
size(640, 480);
textSize(24);
}
void draw()
{
background(255);
stroke(128);
strokeWeight(1);
line(0, height/2, width, height/2);
line(width/2, 0, width/2, height);
limit++; //Increments each frame
if (limit > width) limit = 0;
strokeWeight(3);
stroke(255, 0, 0);
for(int i = 0; i< limit; i++)
{
x = i*TAU/100;
y = 100*sin(x) + 50*cos(x/2);
point(i, y + height/2); // Points for now
}
fill(0);
textAlign(LEFT, CENTER);
text(y, limit+10, y + height/2);
}
```
Take a look at the references and explore the possibilities!
There may be a library out there somewhere; this can be done without one.

🙂
---
### Author:  [@kll](https://discourse.processing.org/u/kll)
#### Post date: [December 27, 2019, 4:20am UTC](https://discourse.processing.org/t/how-to-create-animated-line-graph-in-processing/16643/3 "2019-12-27T04:20:34Z")
and the CSV part could start like:
```auto
// /data/data.csv
/*
date,breakfast,lunch,dinner
2019/12/26,60,80,100
2019/12/27,61,81,101
*/
Table table;
String infile = "data/data.csv";
int trows = 0, tcols;
void setup() {
size(500, 500);
background(200, 200, 0);
get_Table(); // ___________
}
// ____________________________________________________________
void draw() {
// background(200,200,0);
}
// ____________________________________________________________
void get_Table() {
table=loadTable(infile, "header");
trows = table.getRowCount();
tcols = table.getColumnCount();
println("rows: "+trows+" columns: "+tcols+" in file: "+infile);
table.setColumnType("breakfast", Table.INT); // optional type setting...
fill(0); // __________________________________________________________________ text color on canvas
int dy =0;
for ( int c = 0; c < tcols; c++) text( table.getColumnTitle(c)+" ", 10+100*c, 10); //__ header line
dy++;
for ( int r = 0; r < trows; r++) { // ________________________________________ get data lines
TableRow thisrow = table.getRow(r);
for ( int c = 0; c < tcols; c++ ) text( thisrow.getString(c), 10+100*c, 10+15*dy );
dy++;
}
}
```

* * *
actually the most tricky part would be if you want add / edit / the csv data from processing.
tell us if you want go for that.
---
### Author:  [@bluefern](https://discourse.processing.org/u/bluefern)
#### Post date: [December 27, 2019, 5:17pm UTC](https://discourse.processing.org/t/how-to-create-animated-line-graph-in-processing/16643/4 "2019-12-27T17:17:40Z")
Thanks. I´m trying to plot a graph from CSV data.
My data:
[https://gist.githubusercontent.com/bagraprac75/140a58395f359a456ae659d518d45393/raw/b5128215ff8cda948ae82073884fb239605c8fba/daily%2520blood%2520sugar%2520levels.csv](https://gist.githubusercontent.com/bagraprac75/140a58395f359a456ae659d518d45393/raw/b5128215ff8cda948ae82073884fb239605c8fba/daily%2520blood%2520sugar%2520levels.csv)
I’m trying to do is something like this:
[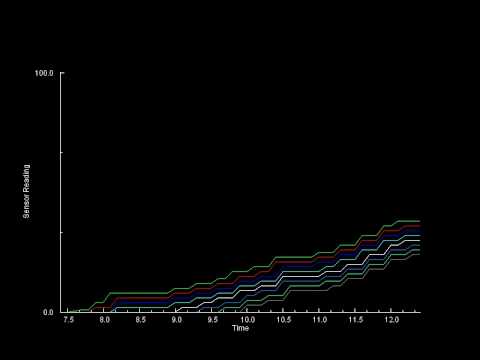 ](https://www.youtube.com/watch?v=lmS6h4_nmqM)
Instead of the data value like the example share by @glv, I’d like the labels (v.gr. Breakfast) to be to the right of the last data point for each series.
How can I do that?
---
### Author:  [@glv](https://discourse.processing.org/u/glv)
#### Post date: [December 27, 2019, 6:31pm UTC](https://discourse.processing.org/t/how-to-create-animated-line-graph-in-processing/16643/5 "2019-12-27T18:31:55Z")
Check out the references:
[https://www.processing.org/tutorials/text](https://www.processing.org/tutorials/text)
[https://processing.org/reference/text\_.html](https://processing.org/reference/text_.html)
My example displays a **numeric value** and you want to display a **string**.
🙂
---
### Author:  [@kll](https://discourse.processing.org/u/kll)
#### Post date: [December 28, 2019, 12:30am UTC](https://discourse.processing.org/t/how-to-create-animated-line-graph-in-processing/16643/6 "2019-12-28T00:30:14Z")
hi,
i see your “data”
and must ask you where you got that from?
as a (running) database that would be not useful,
actually in my example i show how it should look
a day record should be a new line in CSV file… ( and not a column )
( and i have a diabetics spreadsheet file ( google / drive ) for 10 years now )