# Ayuda para mostrar
**URL:** https://discourse.processing.org/t/ayuda-para-mostrar/28706
**Category:** Español
**Tags:** homework
**Created:** [March 22, 2021, 1:41am UTC](https://discourse.processing.org/t/ayuda-para-mostrar/28706 "2021-03-22T01:41:33Z")
**Posts on this page:** 3
**Page:** 1
### Author:  [@Neleya14](https://discourse.processing.org/u/Neleya14)
#### Post date: [March 22, 2021, 1:41am UTC](https://discourse.processing.org/t/ayuda-para-mostrar/28706/1 "2021-03-22T01:41:33Z")
Hola hice un codigo pero no se como compilar las variables, al final necesito que muestre todas las variables que ya hizo y genere con ellas una linea
ejemplo
tiene los puntos x,y
line (xa(anterior),ya(anterior), x,y(actuales);
pero que se vaya como loop y genere una serie de lineas algo asi;
> **[Gráfico lineal](https://www.universoformulas.com/estadistica/descriptiva/grafico-lineal/)**
>
> ¿Qué es un gráfico lineal? Como construirlo y ejemplos. Se compone de una serie de datos representados por puntos, unidos por segmentos lineales.
---
### Author:  [@jafal](https://discourse.processing.org/u/jafal)
#### Post date: [March 22, 2021, 3:17am UTC](https://discourse.processing.org/t/ayuda-para-mostrar/28706/2 "2021-03-22T03:17:00Z")
> [@Neleya14](#):
>
> Hola hice un codigo pero no se como compilar las variables, al final necesito que muestre todas las variables que ya hizo y genere con ellas una linea
>
> ejemplo
> tiene los puntos x,y
> line (xa(anterior),ya(anterior), x,y(actuales);
> pero que se vaya como loop y genere una serie de lineas algo asi;
> **[line() / Reference](https://processing.org/reference/line_.html)**
>
> Draws a line (a direct path between two points) to the screen. The version of line() with four parameters draws the line in 2D. To color a line, use the stroke() function. A line cannot …
> **[Strings and Drawing Text](https://processing.org/tutorials/text/)**
>
> Learn how use the String class and display text onscreen.
[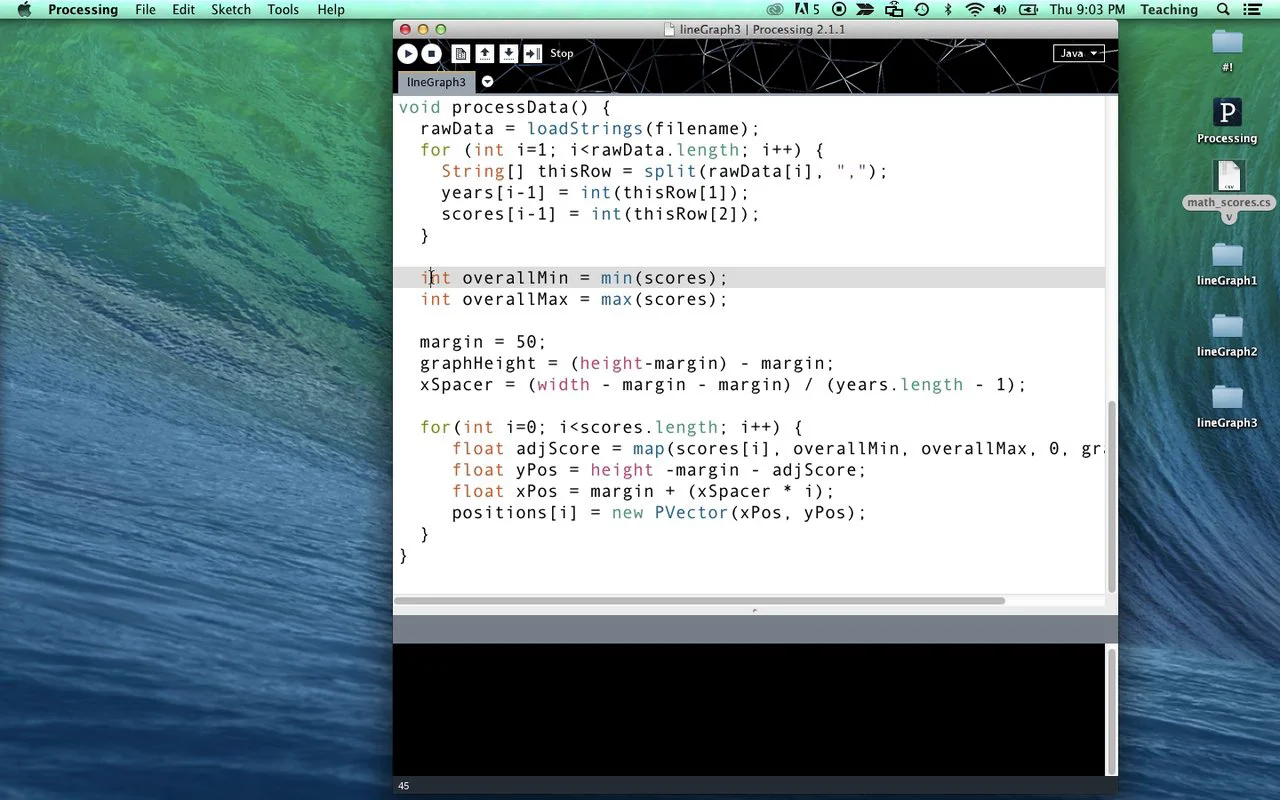 ](https://vimeo.com/88411296)
[https://www.dropbox.com/sh/e0iypqasvdnf8pn/AABCVy7kpcYZ2rwVZBl3QCZ1a?dl=0](https://www.dropbox.com/sh/e0iypqasvdnf8pn/AABCVy7kpcYZ2rwVZBl3QCZ1a?dl=0)
---
### Author:  [@jafal](https://discourse.processing.org/u/jafal)
#### Post date: [March 22, 2021, 5:22am UTC](https://discourse.processing.org/t/ayuda-para-mostrar/28706/3 "2021-03-22T05:22:33Z")
> [@How to use for loop to plot the data into the graph?](https://discourse.processing.org/t/how-to-use-for-loop-to-plot-the-data-into-the-graph/3880):
>
> This is the scatter plot graph that I need to plot the data in. How to use the for loop code to plot the data in? Also how to make different shapes to represent the shape under the for loop code?